1. Introduction
Linux logs are far more than plain text files scattered across a server. They represent the living memory of a Linux system, quietly recording everything that happens beneath the surface. Every crash, performance slowdown, security breach, failed login, misconfiguration, and even simple human error leaves behind a trail in the logs. When systems fail without obvious symptoms, logs are often the only place where the truth still exists.
Many junior engineers treat logs as a last-resort tool—something to search only after a service goes down. Experienced system administrators think differently. They rely on logs not just for troubleshooting, but for understanding system behaviour over time. Logs reveal patterns, expose hidden dependencies, and explain why a system behaved a certain way, even when no one was actively monitoring it. They turn guesswork into evidence.
In this article, you will learn how to analyse Linux logs the way seasoned sysadmins do. Instead of blindly searching for keywords like “ERROR” or “FAILED,” you’ll learn how to build context around events, correlate entries across multiple log files, and separate meaningful signals from background noise. By the end, you’ll understand how to read logs as a narrative of system activity—one that helps you diagnose problems faster, prevent future incidents, and think like a true production engineer.
2. Why Log Analysis Is a Core SysAdmin Skill
Let’s first understand why this is a critical skill every system administrator must have, because logs are the only reliable record of what a system actually did. They help administrators diagnose failures, investigate security incidents, understand performance issues, and verify system behaviour. Without log analysis, troubleshooting becomes guesswork instead of evidence-based problem solving.
Let me tell you how developers and Sysadmins think.
Developers
“Why did my application crash?”
Sysadmin
“What changed in the system, when did it change, and what else did it affect?”
This difference in mindset is crucial because a sysadmin looks beyond a simple application crash and examines every possible factor that could lead to failure. To identify the true root cause, they rely heavily on logs as their primary source of evidence and insight.
Logs are not only for debugging bugs. They are used for:
- Outage analysis: Why did the service go down?
- Security investigations: Was this a breach or a misfire?
- Performance regressions: What changed before latency spiked?
- Compliance & auditing: Who did what, and when?
In production, logs are often the only reliable source of truth. Metrics tell you something is wrong. Logs tell you why.
3. Understanding the Linux Logging Ecosystem
Before diving into log files, it’s essential to understand who generates them and for what purpose. Logs are written by the kernel, system services, applications, and security tools, each with its own intent. Knowing the source helps you interpret entries correctly and avoid false assumptions during analysis.
3.1 Traditional syslog vs systemd-journald
Modern Linux systems usually have two parallel logging systems:
| Logging System | Description | Why It Exists |
|---|---|---|
| syslog (rsyslog) | Plain text logs in /var/log | Simple, portable, human-readable |
| systemd-journald | Binary journal accessed via journalctl | Structured, indexed, metadata-rich |
Sysadmins don’t debate which option is superior. They use both because real-world production environments are messy, inconsistent, and rarely follow a single clean standard.
3.2 Who Produces Logs?
Understanding the source of logs is more important than memorising file paths.
| Source | Examples | What It Tells You |
|---|---|---|
| Kernel | dmesg, kern.log | Hardware, OOM kills, filesystem issues |
| systemd | journalctl | Service lifecycle, failures, restarts |
| Authentication | auth.log, secure | SSH, sudo, login attempts |
| Services | nginx, mysql, docker logs | Application behavior |
| Security | auditd, fail2ban | Suspicious activity |
TIP: When a failure occurs, the incorrect log often appears completely normal, while the correct log is usually messy, noisy, and uncomfortable to read.
3.3 Common Log Locations
Most Linux distributions continue to rely on the traditional /var/log directory as the central location for system and application logs. Some files are given below:
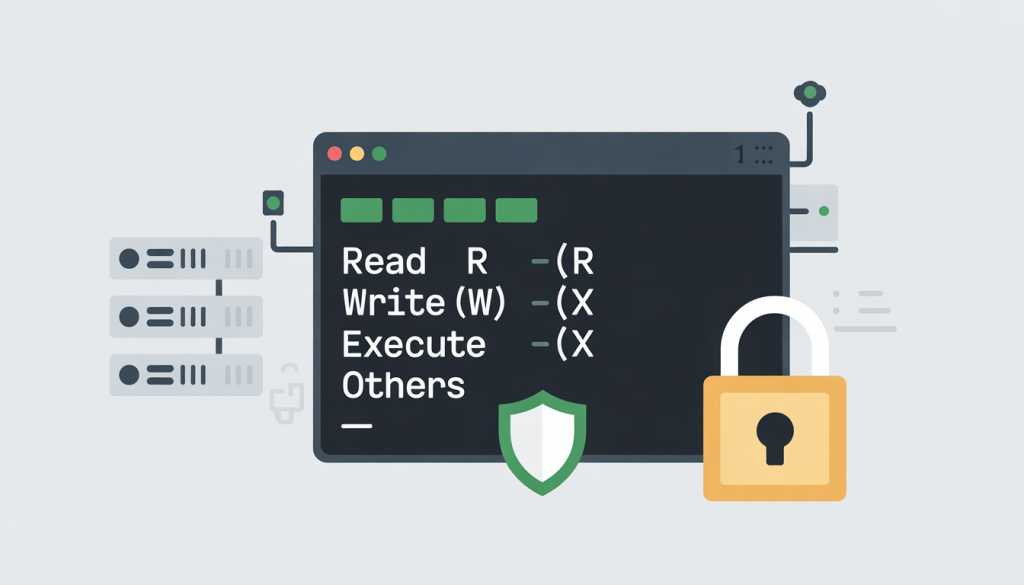
/var/log/syslogor/var/log/messages– general system activity./var/log/auth.log– authentication and sudo/var/log/kern.log– kernel messages/var/log/<service>/– service-specific logs
3.4 Log Rotation: The Silent Trap
Log rotation is a silent trap that often catches even experienced administrators off guard. When logs grow unchecked, they can consume disk space and cause services to fail. To prevent this, systems automatically rotate, compress, and delete old logs. However, misconfigured rotation can erase critical evidence just when it’s needed most. Logs may disappear overnight, break troubleshooting timelines, or hide long-term patterns.
Sysadmins must understand rotation schedules, retention policies, and compression rules to ensure logs are preserved long enough for analysis. Ignoring log rotation doesn’t cause immediate pain, but it quietly undermines reliability, auditing, and incident response when problems finally appear.
4. The SysAdmin Log Analysis Workflow
This is the stage where log analysis stops being reactive and turns into a deliberate, professional workflow. Instead of jumping between files and hoping an obvious error appears, experienced sysadmins apply structured reasoning to reduce noise and expose the real cause of failure. The same is given below.
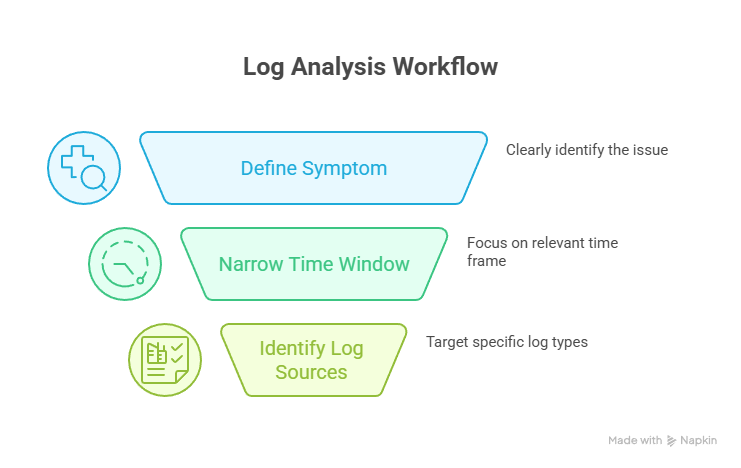
Step 1: Define the Symptom (Before Touching Any Logs)
The biggest mistake beginners make is opening logs without understanding the problem. Before using grep or journalctl, clearly define the symptom:
- What exactly is broken: a service, a feature, or the entire system?
- When did the issue first appear?
- Is the failure constant or intermittent?
- Is it affecting all users, a subset, or a single node?
A precise symptom description acts like a filter. It removes irrelevant logs and prevents you from chasing misleading errors that are unrelated to the actual issue.
Step 2: Narrow the Time Window Aggressively
Time-based filtering is the most powerful log analysis technique. Rarely does the root cause occur at the exact moment of failure. Instead, it usually appears earlier and quietly triggers a chain reaction. Focus on what happened before the problem surfaced and correlate it with:
- Code deployments or rollbacks
- Configuration or permission changes
- System reboots or service restarts
- Traffic spikes or resource exhaustion
- Cron jobs or automated scripts
Once the correct time window is identified, even noisy logs become readable.
Step 3: Identify the Correct Log Sources
Reading every log is inefficient and unnecessary. Each symptom points to specific log sources:
- Services failing to start → systemd journal and service-specific logs
- Authentication or sudo issues → auth and security logs
- System hangs or crashes → kernel and hardware logs
- Network failures → kernel, firewall, and service logs
- Performance degradation → application logs combined with kernel metrics
TIP: Sysadmins don’t hunt for errors everywhere. They follow symptoms, choose the right logs, and let evidence guide the investigation.
5. Essential Log Analysis Tools
Essential log analysis tools help sysadmins extract meaning from massive log data. Utilities like journalctl, grep, awk, sed, less, and tail allow filtering, correlation, and pattern detection. When used together, these tools turn overwhelming log files into structured evidence that reveals failures, trends, and root causes quickly.
Using journalctl is far more powerful than treating it as a simple “cat for logs.” It provides indexed searches, rich structured metadata, precise time-based filtering, and clear per-service views. Instead of scanning flat files, it lets you analyse system activity as a sequence of events, making root-cause analysis faster and far more reliable.
Now, let’s look at the other tools in the table below and understand their advantages—specifically, why sysadmins rely on them in real production environments.
| Tool | Why SysAdmins Use It |
|---|---|
| grep | Fast pattern matching |
| awk | Field-based filtering |
| sed | Cleaning noisy output |
| less | Navigating massive files |
| tail | Live observation |
| zgrep | Searching rotated logs |
6. Pattern Recognition
Logs rarely announce the root cause in a loud, obvious way. Instead, they quietly leave behind subtle clues that must be interpreted with care. A single warning, a repeated timeout, or a small delay between events often matters more than a clear error message. Sysadmins learn to read between the lines, correlating patterns across time and services. The real cause of a failure is usually hidden in context, not in one dramatic log entry.
This is why effective log analysis requires patience, attention to detail, and the ability to connect small signals into a clear narrative of what actually went wrong.
TIP
1. A single error might be noise.
2. The same error every minute is a symptom.
7. Common Production Scenarios
In real-world production environments, sysadmins encounter various issues that can disrupt system stability or application functionality. The table below highlights some common scenarios, the clues logs provide, the actions sysadmins take, the commands they use, and pro tips for faster, smarter troubleshooting.
| Scenario | Common Log Patterns / Clues | Sysadmin Actions | Commands Used | Pro Tip |
|---|---|---|---|---|
| Service Won’t Start | Missing environment variables, permission issues, port conflicts, dependency failures, systemd exit codes, restart loops, failed pre-start checks | Always check systemctl show <service> for detailed exit codes and dependency states, it reveals hidden failure reasons not obvious in logs. | journalctl -u <service>, systemctl status <service>, env, ls -l, netstat -tulpn | Always check systemctl show <service> for detailed exit codes and dependency states; it reveals hidden failure reasons not obvious in logs. |
| High CPU / Memory Usage | OOM killer events, memory pressure warnings, thread exhaustion, slow request buildup | Investigate processes killed by OOM, optimize memory usage, fix thread leaks, identify performance bottlenecks | top, htop, `dmesg | grep -i oom, ps aux –sort=-%mem, vmstat 1` |
| Disk & Filesystem Failures | I/O errors, filesystem remounts as read-only, inode exhaustion warnings, application errors masked as filesystem issues | Check disk and hardware health, remount filesystem, clean up files or expand inode allocation, correlate logs to confirm root cause | `dmesg | grep -i ext4, df -h, mount |
| Authentication & Access Issues | Failed SSH attempts, misconfigured sudo rules, brute force activity, time-based anomalies | Block suspicious IPs, correct sudoers configuration, implement fail2ban or similar protections, cross-check logs for hidden security incidents | `cat /var/log/auth.log | grep ssh, tail -f /var/log/secure, sudo visudo, fail2ban-client status` |
8. Security-Focused Log Analysis
Security-focused log analysis is about reading systems like an investigator, not a repair technician. Instead of reacting only to errors, it examines normal behaviour and looks for subtle deviations over time. Repeated authentication failures followed by a successful login, configuration changes outside maintenance windows, or services restarting without deployment activity are often early indicators of intrusion. This approach values context, timelines, and correlations across multiple logs rather than isolated events. Well-analysed logs act as an early warning system, helping teams detect misuse, lateral movement, and persistence long before alarms fire. In practice, logs remain the foundation of security visibility, even in highly automated environments.
9. Correlating Logs Across Services
Real systems are never isolated. Applications, networks, users, and services constantly interact, creating dependencies that amplify small issues into larger failures. Understanding these connections is critical for troubleshooting and security, because a problem in one layer often originates somewhere else and only becomes visible when multiple components intersect.
Let’s walk through a simple example below to clarify what I mean and help connect the idea more practically.
A frontend timeout might be caused by:
- Backend latency
- Database locks
- Disk I/O
- Network congestion
Now, how syadmin correlate this:
- Same timestamps across logs
- Event chains
- Dependency relationships
That’s why time synchronization (NTP) is critical. Without accurate timestamps, logs lie.
10. Common Log Analysis Mistakes
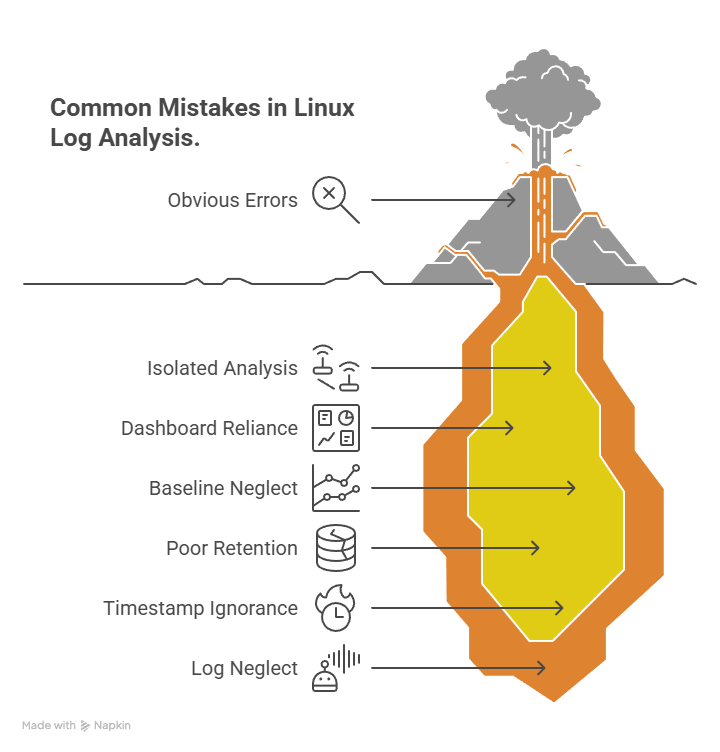
Now, let’s look at some common mistakes engineers often make when working with Linux logs.
- Focusing only on errors and failures, ignoring suspicious successful events
- Analysing logs in isolation instead of correlating across systems and time
- Relying blindly on dashboards and alerts without checking raw logs
- Not establishing a baseline of normal system behaviour
- Poor log retention and rotation, leading to missing investigation data
- Ignoring timestamps, time zones, and the sequence of events
- Treating logs as noise instead of security and operational evidence
11. How Log Analysis Appears in Linux Interviews
Linux interviews rarely test whether you remember log file paths or command flags. What interviewers actually evaluate is how you think when systems fail in unclear, real-world situations.
You’ll often be given open-ended scenarios such as:
- “A service is restarting intermittently. How would you debug this?”
- “Users report login failures, but the application logs look normal.”
- “CPU usage spikes every night without obvious alerts.”
These questions are intentionally vague. Interviewers are listening for your reasoning process, not a specific command.
Strong candidates explain:
- How would they clarify the symptom first
- How would they narrow the time window
- Which logs do they prioritise and why
- How would they correlate system, service, and application logs
- What evidence would help them confirm or discard a hypothesis
Weak answers sound reactive:
- “I’ll grep for ERROR”
- “I’ll restart the service”
- “If logs don’t show anything, I’ll redeploy”
A stronger interview response sounds like this:
“I’d first identify when the issue started and check if it correlates with deployments, cron jobs, or configuration changes. Then I’d review systemd logs for restart patterns, followed by application logs in the same time window. If memory pressure is suspected, I’d also inspect kernel logs for OOM events.”
That answer demonstrates structured thinking, production awareness, and calm troubleshooting—even if the final root cause isn’t immediately clear.
If Linux interviews feel harder than expected, it’s usually because they focus on failure scenarios, not commands.
That’s why I put together a Linux Interview Bundle covering:
- Log-analysis scenarios interviewers actually ask
- Real permission and ownership failures
- Service crashes, OOM events, and silent misconfigurations
- Scenario-based Linux interview questions (not rote commands)
If you want to practice thinking like a sysadmin during interviews, you can check it out here:
LINUX INTERVIEW BUNDLE
12. Conclusion: Think Like a SysAdmin
Logs are not noise; they are an ongoing conversation between a system and the reality it operates in. Every entry captures context, intent, and consequence, waiting to be interpreted correctly. Skilled sysadmins don’t panic when something breaks because they know failures rarely announce themselves clearly. Instead, they read patiently, correlate events across services and timelines, and reason about what changed and why.
They understand that the real root cause is rarely sitting neatly in the last line of a log file, marked as an obvious error. It is usually hidden in earlier warnings, subtle behaviour shifts, or interactions between components. When you learn to analyse Linux logs with this mindset, troubleshooting stops being guesswork.
You move from reacting to symptoms to understanding systems deeply. That transition marks a fundamental shift: the difference between someone who merely uses Linux and someone who truly operates it with confidence and intent.
Explore my other articles on Cloud and Data for more insights, tips, and tutorials. Stay informed and enhance your skills with practical content designed to boost your knowledge. Happy learning!