Linux High Load Average but CPU Low? How to Troubleshoot It (Interview Scenario 1)
Introduction
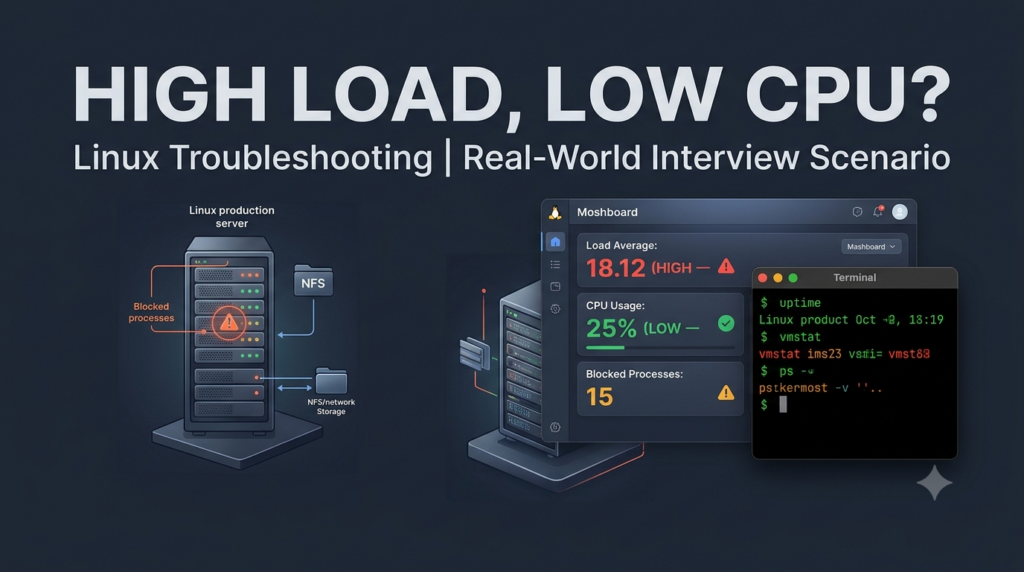
The alert says “high load average 18 on an 8-core server”, so the on-call engineer opens top expecting to see a runaway process. CPU is 75% idle. Nothing is burning. Yet users are complaining and the load number keeps climbing.
This is one of the most common production situations in Linux support you have seen, and one of the most common interview questions for L2/L3, DevOps and SRE roles.
Let’s take a moment to understand why interviewers ask this question and what they expect from you. They want to know whether you truly understand what Linux load average measures or simply assume that high load means high CPU usage.
By the end of this scenario, you’ll have a structured troubleshooting approach that you can confidently explain in your interview.
In this post you will follow a real-looking incident from the first alert to the root cause. You will learn how to:
- read load average, run queue and blocked processes correctly,
- find processes stuck in uninterruptible sleep (state D) and see what they wait for,
- recognize a hung network filesystem from kernel messages,
- prove the cause with evidence and recover safely,
- explain the whole investigation in an interview.
Production Scenario
Let’s consider the below production scenario of High load average
Problem reported : At 02:41 the monitoring team reports: “app-prod-03 load average above 12 for more than 30 minutes”.
Symptoms observed by users : Order exports are delayed, and the web portal shows “export pending” for many orders. Some users see the page load slowly. Nothing was deployed that night.
Business impact : Customers do not receive order files on time, and the support desk is receiving calls. This is a P2 incident that can become a P1 when the morning shift starts.
Information available to the engineer : Load average, a dashboard showing CPU at 25%, and SSH access to the server. There is no obvious error in the application’s own log.
so we have our scenario ready now however most of the candidate look on it and start guessing the results and this one reason is enough to fail their interview. A good candidate will try to understand the problem and try to avoid unnecessary elements from it and make it concise so he leads the interview.
Understand The Problem
What High load average means on Linux
On Linux, load average is the average number of tasks that are runnable (using or waiting for a CPU) plus tasks in uninterruptible sleep(state D, usually waiting for I/O). The three numbers are averages over 1, 5 and 15 minutes
Load Average = Runnable Task + Uninterruptible Task
So a high load with low CPU means many tasks are waiting for something other than CPU.
As you know what load average is really means let avoid some assumption from our scenario.
- Load 18 means the CPU is overloaded because statement shows CPU is low
- “Kill the processes and the load will go away.” Processes in D state cannot be killed until their I/O returns, and killing workers does not fix the cause.
Let’s collect below information before actually starting our troubleshooting
- Number of CPUs
- Load Average Trends (comparing at least 3-5 samples of load average )
- Any recent changes like patching, deployments, network or firewall changes
- When issue started
- Application logs
Once we have above information we are good to start our troubleshooting.
NOTE: In an Interview you can ask for above information. This shows you are deeply understanding the other aspects as well.
Troubleshooting Approach
We will do step by step troubleshooting of this issue and at the end of this you will understand how handle high load average issues.
Step 1: Check the load average
First, let’s understand how high the server load is compared to its CPU cores.
#commands to get load average and cpu cores

$ uptime
load average: 18.12, 17.45, 15.80

$ nproc
8Now we know our load average and cpu cores. As you can we have 8 cores and load average is 18.12 which is unusually high.
Let’s find out whether processes are consuming CPU or simply waiting on next step.
Step 2: Check CPU and blocked processes
#Run vmstat to see whether processes are running or waiting.

$ vmstat 1 5
procs -----------memory---------- ---swap-- -----io---- -system-- ------cpu-----
 r  b   swpd   free   buff  cache   si   so    bi    bo   in   cs us sy id wa st
 2 15      0 812340 210112 6120344    0    0    12     8 1100 2300 20  5 70  5  0
 1 15      0 812100 210112 6120400    0    0     0     0  980 2100 18  4 74  4  0
 2 15      0 811980 210112 6120410    0    0     0     0  990 2150 19  4 73  4  0
let’s decode our vmstat result
r : Processes waiting for CPU.
b: Processes blocked waiting for resources.
wa : CPU time spent waiting for I/O.
id : CPU idle percentage.
I hope now you have better clarity how to read vmstat output. So we know most processes are blocked, while CPU is still idle. This suggests the problem may be related to I/O rather than CPU usage.
Let’s identify the blocked process in next step.
Step 3: Identify blocked processes
$ ps -eo state,pid,ppid,wchan:32,cmd | awk '$1 ~ /^D/'
D 3101 2980 nfs_wait_bit_killable /opt/orders/worker
D 3102 2980 nfs_wait_bit_killable /opt/orders/workerThis gives us our first strong clue: investigate the NFS connection.
Step 4: Check kernel logs
Before moving to NFS connection let’s confirm whether the kernel has reported any NFS issues.
$ sudo journalctl -k --since "02:00" --no-pager | grep -i nfs
[Tue Oct 27 02:07:14 2026] nfs: server nfs01 not responding, still trying
[Tue Oct 27 02:09:15 2026] INFO: task worker:3101 blocked for more than 120 seconds.
[Tue Oct 27 02:09:15 2026]       Not tainted 5.14.0-427.13.1.el9_4.x86_64 #1
[Tue Oct 27 02:09:15 2026] "echo 0 > /proc/sys/kernel/hung_task_timeout_secs" disables this message.
The kernel confirms that the NFS server stopped responding. We now have evidence that the issue is related to NFS communication.
I recommend check out a detailed article on log Analyze here.
Step 5 : Check the NFS mount
Let’s identify which NFS mount is affected and review its configuration.
$ findmnt -t nfs,nfs4
TARGET        SOURCE               FSTYPE OPTIONS
/mnt/exports  nfs01:/export/orders nfs4   rw,relatime,vers=4.1,rsize=1048576,wsize=1048576,hard,proto=tcp,timeo=600,retrans=2,sec=sys,addr=10.0.9.30
From the above output we can sayNFSv4.1 mount is configured with the hard option. When the server stops responding, the client continues retrying, causing application processes to wait.
Now let check if users are able to reach NFS server
Step 6 : Test NFS connectivity
$ ping -c 3 nfs01
3 packets transmitted, 3 received, 0% packet loss, time 2003ms
$ nc -vz -w 3 nfs01 2049
nc: connect to nfs01 port 2049 (tcp) failed: Connection timed out
Now we know server is reachable, but the NFS port is not responding. This points towards a possible firewall or network issue.
Step 7 : Investigate the NFS server
Now let run few commands to check NFS server
$ sudo systemctl is-active nfs-server
active
$ sudo ss -ltn sport = :2049
LISTEN 0 64 0.0.0.0:2049 0.0.0.0:*
$ sudo firewall-cmd --list-services
cockpit ssh
$ sudo journalctl -u firewalld --since "02:00" --until "02:10" --no-pager
Oct 27 02:05:38 nfs01 systemd[1]: Stopping firewalld - dynamic firewall daemon...
Oct 27 02:05:39 nfs01 systemd[1]: Started firewalld - dynamic firewall daemon.
$ sudo dnf history | head -3
ID | Command line | Date and time    | Action(s) | Altered
 87 | update -y    | 2026-10-27 02:05 | Upgrade   |      9
let’s decode our observations from the above output
- NFS service is active.
- Port 2049 is listening.
- Firewall allows only
cockpitandssh. - Firewall restarted around 02:05.
So we now reached at the end of our troubleshooting and got information that Firewall started around that time when user started reporting issue.
Now, let’s put together the RCA. This will help demonstrate to the interviewer that you follow a structured troubleshooting approach and can identify the root cause systematically.
Root Cause Analysis (RCA)
Symptoms: Load average reached 18 on 8 CPU cores, with 15 workers stuck in D state. Order exports were delayed, although CPU usage remained low at 25%.
Root Cause: The NFS server firewall was blocking TCP port 2049 because the NFS rule was added at runtime but never saved permanently. A firewalld restart during a package update removed the rule.
Investigation: We identified blocked processes using vmstat and ps, confirmed NFS timeouts in kernel logs, and found that ping worked while TCP port 2049 was unreachable.
Why Monitoring Missed It: CPU, memory and NFS service status appeared healthy. Monitoring did not check NFS port connectivity.
Key Takeaway: High load does not always mean high CPU usage. Always investigate blocked processes, I/O dependencies and network connectivity before concluding that the issue is CPU-related.
Solution and Resolution
Important
Do not kill workers with kill -9 or force-unmount the NFS filesystem during troubleshooting. You may risk in-flight writes.
1. Restore the NFS firewall rule
#1. Restore the NFS firewall rule

sudo firewall-cmd --permanent --add-service=nfs
sudo firewall-cmd --reload
sudo firewall-cmd --list-servicesThis permanently saves the NFS rule and applies it to the running firewall.
2. Verify connectivity and process recovery
#  Run on the client:
nc -vz -w 3 nfs01 2049
ps -eo state | grep -c '^D'
vmstat 1 3
uptimeExpected results:
- TCP port 2049 connection succeeds.
- D-state process count drops to zero.
- Blocked processes (
b) decrease to zero. - Load average gradually returns to normal.
3. Validate the application
After restoring NFS connectivity, verify that:
- The NFS port 2049 is reachable from the client.
- Application workers resume processing.
- Worker logs show successful order exports.
- The pending order count in the portal starts decreasing.
Confirm that the mount responds, workers resume processing, and pending order exports decrease.
Resolution: Restoring the missing firewall rule resolves the NFS connectivity issue, allowing blocked workers to resume without restarting the application.
How to Prevent This Again
Now that we’ve completed the RCA, let’s discuss how to prevent this issue from happening again.
Why is this important? Because one of the most common follow-up questions in scenario-based interviews is: “How would you prevent this issue from happening in the future?”
For this scenario you can mention below ones
- Monitoring: Alert on blocked processes, load per CPU core, and NFS port connectivity.
- Configuration management: Use Ansible to manage firewall rules with permanent: true and immediate: true.
- Patching: Validate NFS connectivity from a client after every server update or firewall restart.
- Health checks: Add a timeout-based NFS mount check to application monitoring.
- Documentation: Add a runbook entry: High load + low CPU + D-state processes = investigate storage and network filesystems first.
Interview Questions and Answers
Now that we’ve completed the scenario, here’s a bonus! I’ve included some related interview questions to help you test your understanding and feel more confident when facing similar troubleshooting questions in interviews.
A server has load average 18 and CPU is 25% used. What is your first thought?
The load is probably made of blocked tasks, not CPU work. I would run vmstat 1 5 and compare r (runnable) with b (blocked), then list D state processes.
How do you find the processes in D state and what they wait on?
I use ps -eo state,pid,ppid,wchan:32,cmd to identify blocked processes. The wchan column helps identify the kernel function where a process is waiting. For example, nfs_wait_bit_killable suggests an NFS-related wait.
Why can’t you kill -9 a process in D state?
It is inside a kernel operation waiting for I/O, and signals are handled only when it returns to user space. It leaves D state when the I/O completes or fails. So the fix is to restore the resource it waits for.
Can load be high while iowait is low?
Yes. iowait counts idle CPU time while I/O is pending, and it depends on how many CPUs are idle. Blocked tasks on a hung network filesystem can raise the load without showing much iowait. vmstat’s b column and the D state list are more reliable
What are the trade-offs of hard and soft NFS mounts?
hard retries forever, which protects data integrity but makes applications hang when the server is down. soft returns an error after the timeout, so applications fail fast, but a write can be lost or partially written. For critical writes use hard, with monitoring and sensible timeo and retrans values.
How would you alert on this before users notice?
Alert on blocked process count above a threshold for a few minutes, on NFS client messages (“not responding”) in logs, and on a synthetic probe to the NFS port. Combine load with CPU so that “high load, low CPU” has its own alert and runbook link.
What Interviewers Expect From You?
- A method, not a guess: start with the number you were given (load 18), compare it with the core count, then split runnable from blocked tasks before choosing a direction.
- Fundamentals: explain that Linux load includes D state tasks, what wchan shows, and why kill -9 does not work on them.
- Evidence-based RCA: every conclusion is backed by a command output and a time. You separate symptoms (load, D state) from the root cause (the lost firewall rule).
- Production safety: you avoid commands that hang (ls on a dead mount), you do not force-unmount or kill blindly, and you warn about data loss.
- Communication and ownership: you say what you checked, what you found, what you will do next and who you need (the NFS owner), and you suggest prevention.
Pro Tip
If you do not know something, say so and explain how you would find out. That is better than a confident guess.
Final Takeaway & Continue Your Linux Interview Preparation
Remember, high load doesn’t always mean high CPU usage. Linux load average also includes processes waiting for I/O or network filesystems. Commands like uptime, vmstat and ps help identify blocked processes, while network tests help narrow down connectivity issues. Always save firewall rules permanently to avoid unexpected failures after restarts.
Want to practise more real-world Linux troubleshooting scenarios?
Real interviews test more than memorized commands. They test how you investigate production issues, identify root causes and explain your troubleshooting approach.
I’ve created a comprehensive Linux Scenario-Based Interview Question Kit featuring 200 real-world scenarios, practical commands, step-by-step investigations, RCA, solutions and related interview questions.
You can start with free sample questions before deciding whether the complete kit is right for you.