Grafana Loki Tutorial: A Beginner to Intermediate Guide for Modern Log Management
1. Introduction
Log management today is an indispensable element of keeping applications and services running smoothly in modern infrastructure. Whether you use microservices, containers, or large Kubernetes clusters, logs are the key to uncovering failures, analysing performance problems, and figuring out user-impacting incidents before they escalate. Nevertheless, as the environment grows, traditional logging systems may bring about a few new issues.
Most older ones need intensive indexing, take up a lot of space, and generally become quite costly to run. Also, handling them can be quite a challenge when different teams require rapid access to distributed systems. That is exactly why Grafana Loki has appeared on the scene as a contemporary observability stack choice.
Unlike the traditional log tools that handle logs separately, Grafana Loki extends alongside metrics and traces, providing a more integrated view of system health for the teams while at the same time simplifying the environment. Due to its minimalistic engineering, it is a perfect fit for cloud-native platforms.
In this blog, you will learn what Grafana Loki is, how it works, why teams are adopting it, and how to start using it effectively for centralised logging in modern DevOps workflows.
2. Grafana Loki – A Overview
Now let’s take a deeper dive into the world of Loki and understand what it is, how it works, and what makes it different from traditional log management stacks like the ELK stack.
2.1 What is Grafana Loki?
Loki is a scalable and highly available log aggregation system inspired by Prometheus. The main difference is that Prometheus collects and stores metrics, while Loki is built to collect and manage logs by receiving them via a push-based method rather than a pull-based one.
Loki is designed to be very cost-effective and highly scalable. Unlike other logging systems, Loki does not index the contents of logs; it only indexes metadata about your logs as a set of labels for each log stream.
2.2 How Loki Works?
As we know, Loki only indexes metadata about your logs as a set of labels for each log stream. Let’s break it down into more detailed parts for understanding.
A log stream is a group of logs that have the same labels. Labels are used by Loki to locate a log stream in your data storage; therefore, having a good set of labels is very important for an efficient query run.
The logs are then compressed and saved in pieces in an object storage system like Amazon Simple Storage Service (S3), Google Cloud Storage (GCS) or, for development or proof of concept, simply on the filesystem. A tiny index and very condensed chunks make the work easier and drastically reduce the cost of Loki.
2.3 Understand Labels
Labels are a crucial part of Loki. They allow Loki to organise and group together log messages into log streams. Each log stream must have at least one label to be stored and queried in Loki.
In Loki, the content of each log line is not indexed. Instead, log entries are grouped into streams, which are indexed with labels.
A label is a key-value pair. For example, all of the following are labels:
- deployment_environment = development
- cloud_region = us-west-1
- namespace = grafana-server
Labelling will affect your queries, which in turn will affect your dashboards. It’s worth spending the time to think about your labelling strategy before you begin ingesting logs to Loki. You can refer to the official Loki documentation for more details on Labels.
3. Grafana Loki Architecture
Now we understand how Loki works, and let’s discuss about its architecture in details.
Grafana Loki adopts a microservices-based architecture and intends to be a horizontally scalable, distributed system that can be distributed across multiple servers. It consists of several components that can operate independently and simultaneously. However, the Grafana Loki architecture compiles the source code of all components into one binary or Docker image. Then, the -target command-line flag determines the component(s) role(s) that the binary will take.
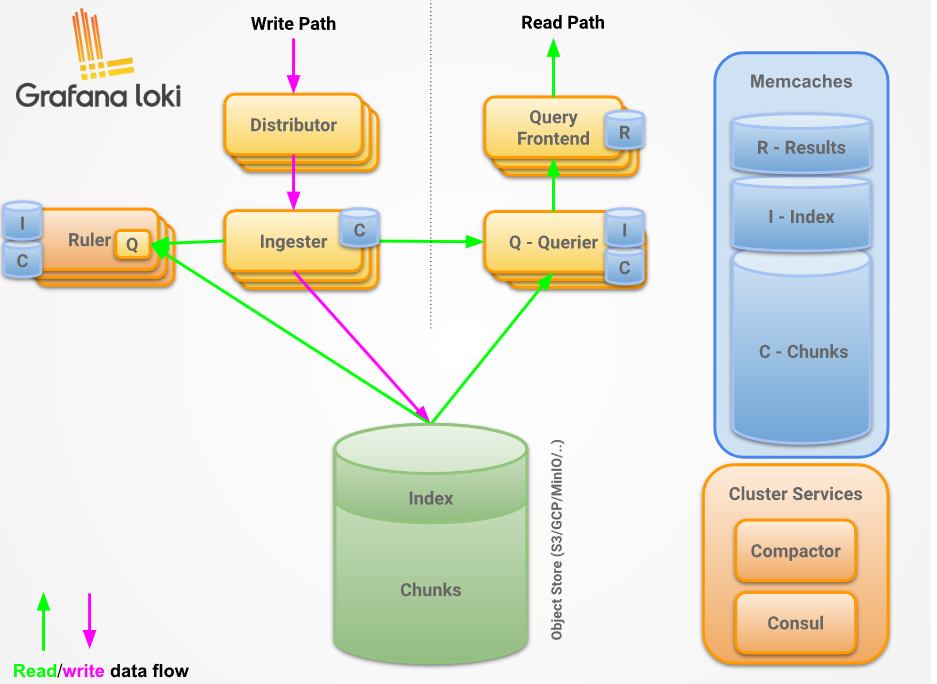
As you can see above, Loki has below core components
- Distributor: – This service is responsible for handling incoming push requests from clients. It’s the first step in the write path for log data. Once the distributor receives a set of streams in an HTTP request, each stream is validated for correctness and to ensure that it is within the configured tenant (or global) limits. Each valid stream is then sent to n ingesters in parallel, where n is the replication factor for data. The distributor determines the ingesters to which it sends a stream using consistent hashing.
- Ingester: – This service is responsible for persisting data and shipping it to long-term storage (Amazon Simple Storage Service, Google Cloud Storage, Azure Blob Storage, etc.) on the write path, and returning recently ingested, in-memory log data for queries on the read path. Ingesters contain a lifecycler, which manages the lifecycle of an ingester in the hash ring. Each ingester has a state of either PENDING, JOINING, ACTIVE, LEAVING, or UNHEALTHY
- Query frontend: – This is an optional feature that provides API endpoints to the querier, which can be leveraged for a quicker read path. Once the query frontend is implemented, all the query requests should be redirected to it instead of the queriers. However, in a cluster, the querier service is necessary for executing the queries themselves.
- Compactor: – Shipper stores (for example, single store TSDB or single store BoltDB) contact the compactor service to combine several index files produced by the ingesters and sent to object storage into individual index files per day and per tenant. This allows index lookups to be faster. The compactor essentially fetches the files from object storage, at fairly regular intervals, merges them into one, and then uploads the new index, deleting the old files in the process. On top of that, the compactor is the component that handles log retention and log deletion. Typically, the compactor service is deployed as a single instance in a Loki deployment.
I suggest checking the official Loki docs for a more detailed version of its architecture.
4. Common Grafana Loki Issues and How to Fix Them
Now that we have understood the Loki architecture and its working, it’s time to check some common issues and their solutions while running Loki.
4.1 Logs Are Not Appearing in Grafana
One of the most common issues is when logs are successfully generated by applications but do not appear inside Grafana.
Below are some possible causes
- Promtail is not running
- Wrong Loki endpoint configured
- Incorrect file path in Promtail
- Label mismatch
Now, let’s check the solution to this
- Check Promtail container logs and configs and ensure it’s running fine.
- Verify Loki endpoints and ensure it’s running healthy.
- As Labels play an important role, ensure Lables should be correct.
4.2 Slow Log Queries
Queries take too long to return results.
Below are possible causes
- Searching over large time ranges
- Poor label structure
- Storage backend latency
As a solution, we can do the following
- Use narrower queries:
{app="api"} |= "error"Instead of:
{job="all"}- shorten the time range
- optimise storage backend
4.3 High Memory Usage in Loki
Loki consumes more memory than expected under heavy workloads.
Possible causes
- Large ingestion bursts
- Too many active streams
- High-cardinality labels
Solution can be below ones
- Use stable labels like the examples below
# this is stable label
labels:
  app: nginx
  env: production

# this is bad label
labels:
request_id: abc123- Reduce chunk settings if needed.
There are many other issues as well when we worked with Loki or with other log management tools, such as well like ELK
5. When Loki is the Right Choice
Graphana Loki offers a good option for teams wanting a logging system that is easy to work with, cost-effective, and more compatible with the needs of modern environments. Traditional log systems that index each log line are quite heavy on disk space, but Loki achieves better storage efficiency by only indexing labels.
So if you produce very large numbers of logs per day, it ought to be pretty well suited to your needs. The best part of using Grafana in a committed way, in addition, with a couple of clicks, you can check and cross-analyse all the logs and metrics at the same time. That will undoubtedly be a very big help in functional communication as well as navigating through different tools and reducing overhead.
Loki is often the best fit when you need:
- Lower storage costs compared to traditional logging stacks
- Native support for Kubernetes and container workloads
- Easy integration with existing Grafana dashboards
- Simpler deployment and maintenance for DevOps teams
- Scalable logging without complex infrastructure
If your environment is cloud-native and your team prefers a lightweight logging platform that still handles production workloads well, Loki can be a strong and practical choice.
6. Conclusion
Overall, Grafana Loki has become a practical choice for teams that need modern log management without dealing with the heavy setup of traditional logging platforms. Its lightweight architecture helps reduce infrastructure costs compared to the ELK stack, while still giving enough scalability for applications that continue to grow.
For DevOps teams, Loki makes it easier to bring logs into one place, speed up troubleshooting, and keep observability more organized. Beginners can get started without a steep learning curve, and intermediate users can still use its advanced features as their environments become more complex. If you want to build a deeper understanding of Loki, you can also check out my Loki interview questions guide to help you prepare for real-world DevOps interviews and technical conversations.